Navigation: Developers' Guide >
Debugging
Debugging is a process that developers perform to identify bugs in the application and troubleshot them. Like any other project, developers can debug the iVend AddOn code using iVend AddOn Framework.
In order to debug the Management Console or the POS bugs, it is needed to attach to process of the respective application. In the illustration below iVend Retail Management Console is selected as process. Developers then preform specific checks to identify and fix the bugs.
There are following steps to perform debugging:
1.Open the AddOn project.
2.Identify the code section where there is possibility of error.
3.Create a breakpoint.
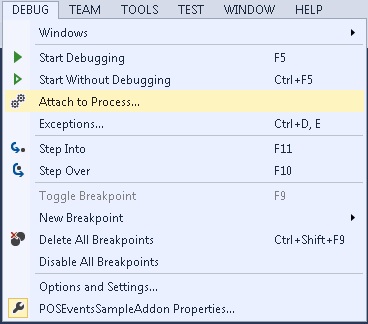
Press the F9 key or on the DEBUG menu, click Toggle Breakpoint to create a breakpoint. The red circle ![]() appears at the start of the code line after creating a breakpoint.
appears at the start of the code line after creating a breakpoint.
4.Then on the DEBUG menu, click Attach to Process...

5.Select a process from the Available Process section.

6.Then click the Attach button.
7.Press the F5 key to execute debugging.