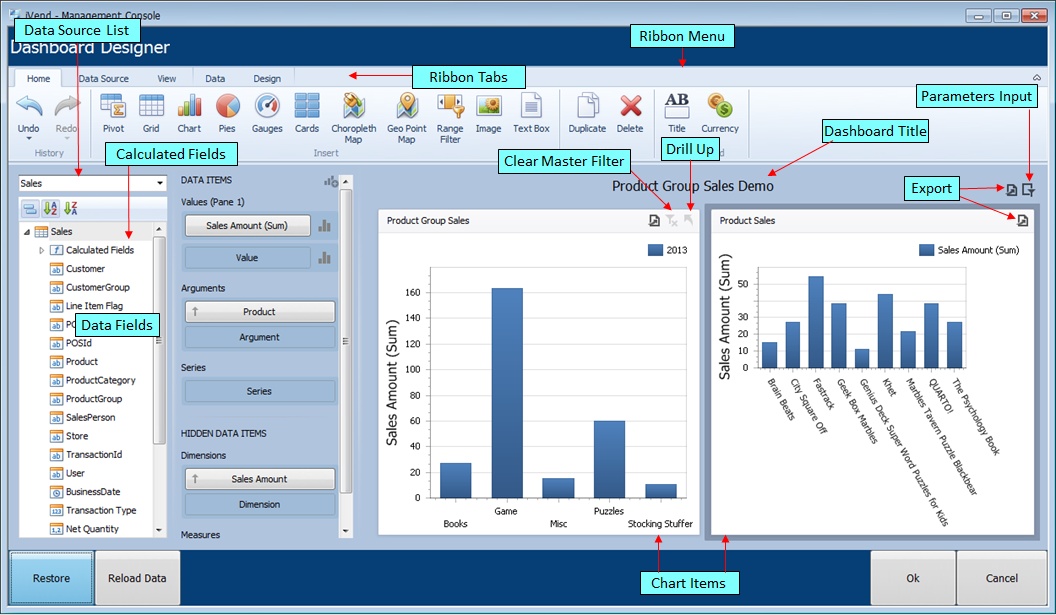
Dashboard Designer This feature enables to design dashboards for viewing and printing. To open Dashboard Designer select Reports -> Dashboard Designer
To view the dashboard created, choose Reports > Dashboard Designer
Search Screen
Setup Screen
Dashboard Designer Screen Dashboard designer contains Ribbon menu, Data Source List, Field List, Dashboard for placing chart items.
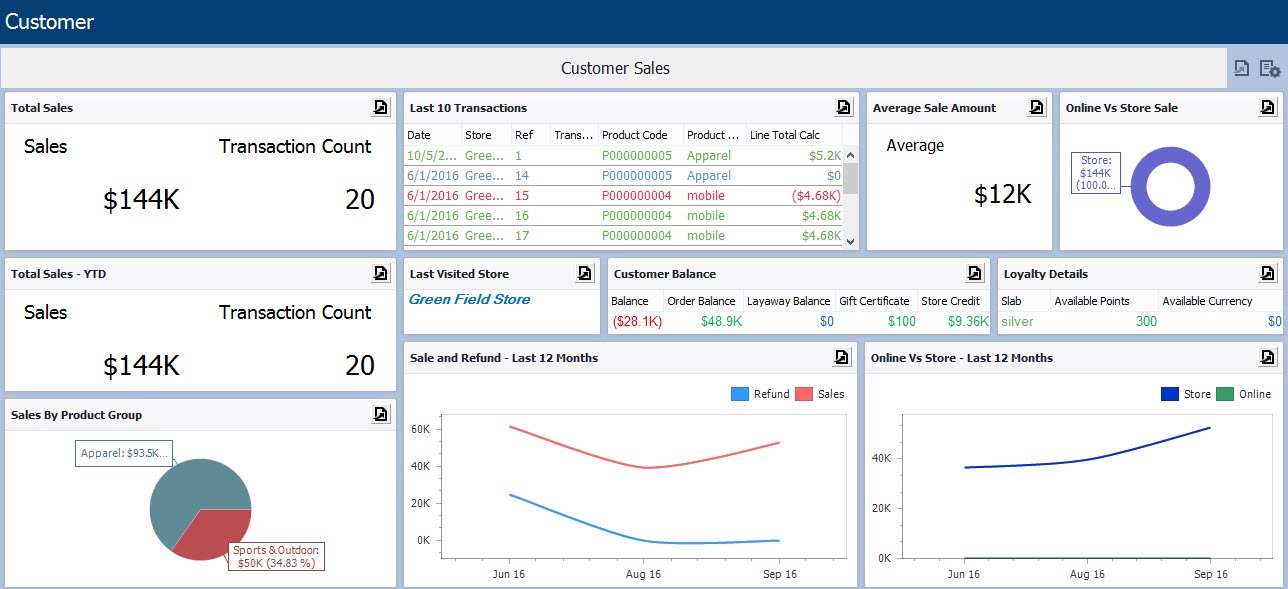
Customer Dashboard The Customer Sales dashboard shows various information related to customer sales. To open the Customer dashboard screen, browse through Operations > Business Partner > Customer and click the
The Customer dashboard screen contains following sections: •Total Sales: This section displays sales refund and transaction count values. oSales Refund: This widget displays all sales data from the beginning with Transaction count. oTransaction count: This widget includes number of transactions for Sale, Refund, Order, and Layaway. Transaction count does not include Void, and Suspend Transaction values. •Total Sales YTD: This section displays sale refund and transaction count values. oSales Refund: This widget will display all sales data from the year to date with transaction count. oTransaction Count: This widget includes number of transactions for Sale, Refund, Order, and Layaway. Transaction count does not include Void, and Suspend Transaction values. •Sales By Product Group: This widget displays sales by product group in pie graph. •Last 10 Transactions: This widget displays last 10 transactions in grid view, which include Date, Store, Transaction No, Product Code, Description and Line Total. •Last Visited Store: This widget displays the Last Transaction Store Name. •Customer Balance: This Widget displays customer balances including Balance, Order Balance, Layaway balance, GC Balance, and Store Credit Balance. The GC Balance and Store Credit Balance are shown separately which include sum total of GC balance and sum total of store credit balance. •Sale and Refund Last 12 Months: This widget displays the sale and refund data month view with two-line graph. This widget displays the data only for the month in which sales /refunds are transacted. •Average Sale Amount: This widget displays an average sales amount that is Total Sale Amount excluding refund/Number of sale Transaction excluding refund. •Loyalty Details: This widget displays customer loyalty slab and loyalty points details. The Registration method customer code and loyalty card attached to customer code are only required. •Online Vs Store Last 12 Months: This widget displays online and retail store data with two-line graph in monthly manner. This widget displays data only for the month in which online sales /retail store actually happens. •Online Vs Store Sale: This widget displays the eCommerce store sales versus Retail Store sales in pie chart.
Refer the following screen showing Customer dashboard:
Note: -Click the Close button to return to the Customer screen. -The Customer dashboard screen can be opened only from the Customer screen by clicking the
Product Dashboard
The Product dashboard shows various information related to product sales. To open the Product dashboard screen, browse through Operations > Business Partner > Product and click the
The Product Inventory screen contains following sections: •Total Sales: oSales: This widget will display all sales data from the beginning with quantity sold. oQuantity: This widget displays net quantity sold which does not include the Void, and Suspend Transaction. •Total Sales - YTD: oSales: This widget will display all sales data from the year to date with quantity sold. oQuantity: This widget displays net quantity sold which does not include the Void, and Suspend Transaction. •Stock Cover (Weeks): This widget displays stock availability for the number of weeks. For example, if it shows 1579 then it means that the stock available in the store will last up to 1579 weeks. •Sale and Refund Last 12 Months: This widget displays the sale and refund data in monthly manner with two-line graph. This widget only displays the data of month in which sales /refund are transacted. •Online Vs Store Last 12 Months: This widget displays the online and retail store data monthly manner with two-line graph. This widget only displays the data of month in which online sales /retail store sale are transacted. •Online Vs Store Sale: This widget displays the e-Commerce store sale versus retail store sale in pie chart. •Available Stock and Value: This widget displays the store wise total product stock and total product value. •Ordered & Fulfillment Qty.: This widget displays the ordered quantity, which includes open purchase order quantity and fulfillment quantity. •Product Category and Contribution: This widget displays the product category and contribution where the product Category shows a group name under ABC Group using ABC Analysis and Contribution shows product contribution percentage using ABC Analysis. •Profit Margin and Percentage: This widget displays the product profit margin value and percentage.
Refer the following screen showing Product dashboard:
Note: -Click the Close button to return to the Product screen. -The Product dashboard screen can be opened only from the Product screen by clicking the |
||||||||||||||||||||||||||||||||||||||||||||||||||||||||||||||||||||||||||||||||||||||||||||
© CitiXsys 2019. All Rights Reserved.


